Saturday, October 27, 2018

Mark to Market Returns turns Negative

At the beginning of 2018, my mark to market returns were around $15,000. However the recent downturn in the Singapore market erased all these returns. You can see the 'Total profit (mark to market)' entry is negative below:


Some causes of the recent downturn in the market could be due to Trump's trade war with China. And also the lackluster property market in Singapore with the introduction of more cooling measures by the government.

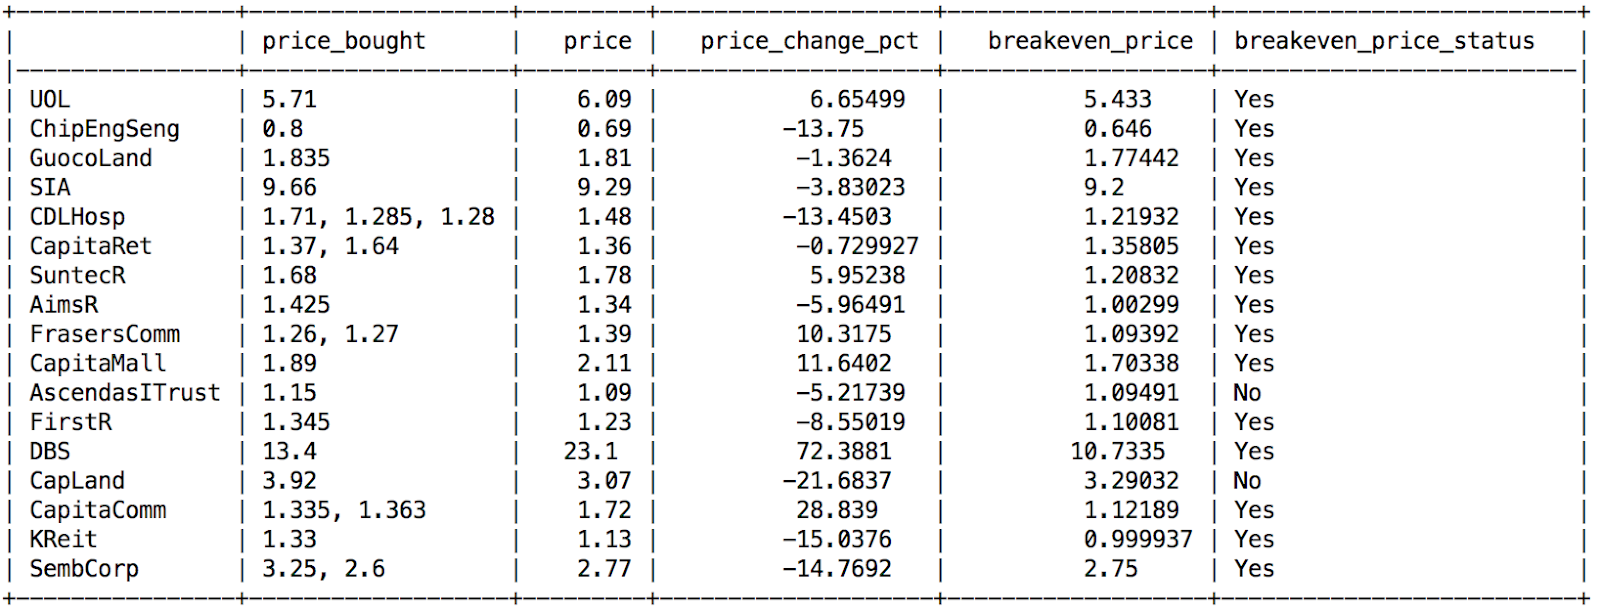
Fortunately, with dividends, my returns are still positive.

As my investment duration is ~30 years till retirement, it pays to stay invested in the market.

If I have more 'bullets', I will buy more now.

Portfolio Snapshot - Breakeven Price Oct 2018

Here's another snapshot of my portfolio based on breakeven price:


The column 'price' indicates the current price of the stock.

The column 'breakeven_price' indicates the breakeven price of the stock with dividends and stocks from distribution reinvestment plan included. As long as the price of stock is above the breakeven price, I can sell the stock for a profit.

The column 'breakeven_price_status' indicates if the stock price is above the breakeven price.

Portfolio Snapshot - CAGR Oct 2018

Here's a snapshot of my current portfolio:


The column 'cagr' represents the compound annual growth rate of that stock.

The column 'cagr_inc_div_drp' shows the compound annual growth rate including dividends paid out and additional stocks obtained through distribution reinvestment plans.

The column 'cagr_benchmark' shows the compound annual growth rate of the benchmark. The benchmark is the SPDR STI ETF, stock code 'ES3'.

The column 'cagr_benchmark_status' shows yes if we beat the benchmark. The more 'Yes' the better.

The column 'returns_one_year' shows the returns in the past one year.

The columns 'cagr', 'cagr_inc_div_drp', 'cagr_benchmark', 'returns_one_year' are shown in percentages.