Back in Oct 27, 2018 I posted my mark to market returns turned negative. Well, now they have turned positive again after 2.5 months!
Likely because of signs of:
* resolutions in Trump's trade war with China,
* resolution in the territorial dispute between Singapore and Malaysia,
* Fed's dovish statements on slowdown in interest rate hikes,
* and hopes that the US Government shutdown will end soon.
Check it out (Total profit (mark to market)):
Wednesday, January 9, 2019
Sunday, December 30, 2018
Financial Snapshot - Dec 2018
This is a snapshot of my finances at end of 2018.
Naturally, I do not want to disclose too much details or my net worth, amount I have in banks etc. so I will just share the following:
Not included in the above are bank savings, insurance policies, CPF, SRS etc. The above are just the amount of stocks and cash in my 2 stock brokerage accounts, the stocks in my BCIP and SRS account, and the bonds I am holding at the moment. Since starting work in the US from Oct 2017 onwards, I also added my 401K and Wealthfront investments to the above.
Naturally, I do not want to disclose too much details or my net worth, amount I have in banks etc. so I will just share the following:
| Year ending | Stocks | Bonds | Cash for investment | Net cash input |
|---|---|---|---|---|
| 2015 | 52451.71 | 20872 | 8335.63 | 0 |
| 2016 | 105461.92 | 20905 | 5839.25 | 25900 |
| 2017 | 189466.76 | 25502.18 | 1994.31 | 34823.9 |
| 2018 | 229823.25 | 27387.34 | 248.26 | 34120.43 |
Not included in the above are bank savings, insurance policies, CPF, SRS etc. The above are just the amount of stocks and cash in my 2 stock brokerage accounts, the stocks in my BCIP and SRS account, and the bonds I am holding at the moment. Since starting work in the US from Oct 2017 onwards, I also added my 401K and Wealthfront investments to the above.
Sunday, November 25, 2018
Portfolio Snapshot - Passive Income
From my post on Dec 11, 2016, I stated:
"Will be sharing my passive income (dividends, bond coupons, bank deposit interest, fixed deposit interest, MMF interest) around this time every year."
But I forgot to do it for 2017. Anyway, I am sharing now in 2018:
As shown above, my monthly passive income is $766.48. Once I increase this to my monthly expenditure amount, I can retire!
"Will be sharing my passive income (dividends, bond coupons, bank deposit interest, fixed deposit interest, MMF interest) around this time every year."
But I forgot to do it for 2017. Anyway, I am sharing now in 2018:
Saturday, October 27, 2018
Mark to Market Returns turns Negative
At the beginning of 2018, my mark to market returns were around $15,000. However the recent downturn in the Singapore market erased all these returns. You can see the 'Total profit (mark to market)' entry is negative below:
Some causes of the recent downturn in the market could be due to Trump's trade war with China. And also the lackluster property market in Singapore with the introduction of more cooling measures by the government.
Fortunately, with dividends, my returns are still positive.
As my investment duration is ~30 years till retirement, it pays to stay invested in the market.
If I have more 'bullets', I will buy more now.
Some causes of the recent downturn in the market could be due to Trump's trade war with China. And also the lackluster property market in Singapore with the introduction of more cooling measures by the government.
Fortunately, with dividends, my returns are still positive.
As my investment duration is ~30 years till retirement, it pays to stay invested in the market.
If I have more 'bullets', I will buy more now.
Portfolio Snapshot - Breakeven Price Oct 2018
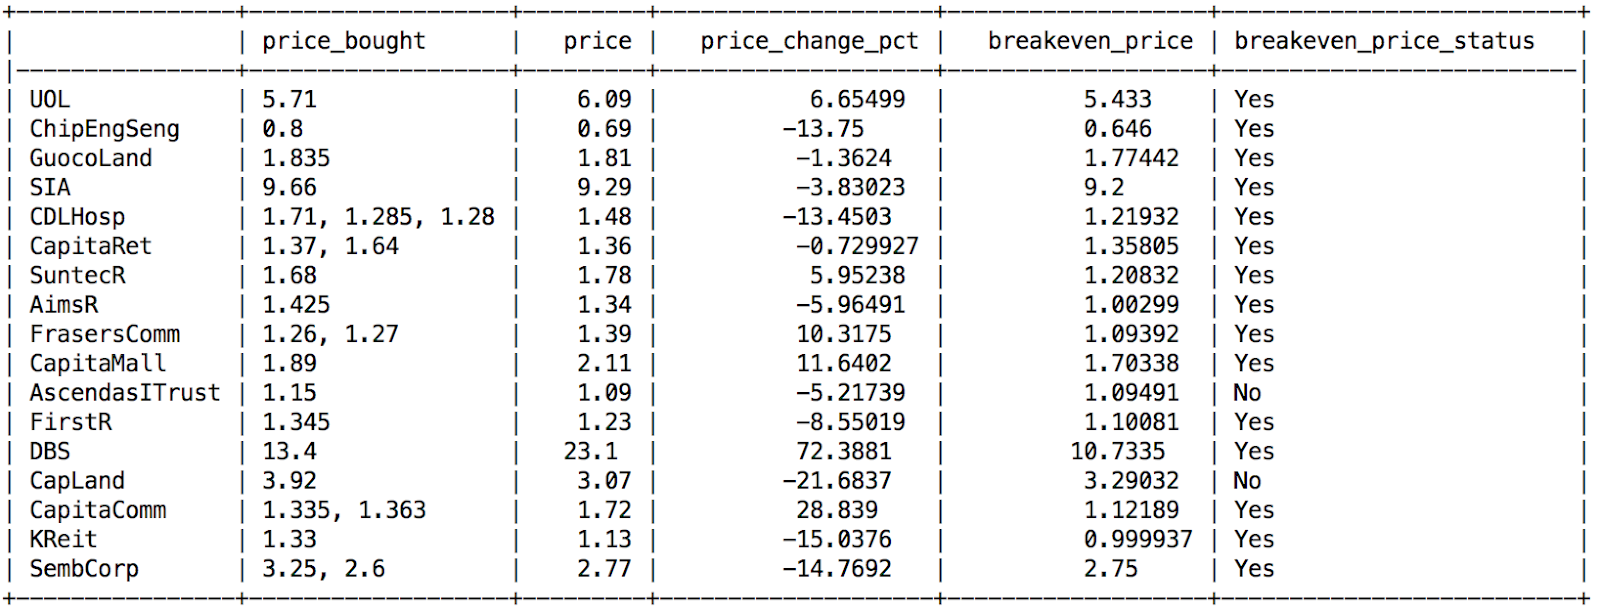
Here's another snapshot of my portfolio based on breakeven price:
The column 'price' indicates the current price of the stock.
The column 'breakeven_price' indicates the breakeven price of the stock with dividends and stocks from distribution reinvestment plan included. As long as the price of stock is above the breakeven price, I can sell the stock for a profit.
The column 'breakeven_price_status' indicates if the stock price is above the breakeven price.
The column 'price' indicates the current price of the stock.
The column 'breakeven_price' indicates the breakeven price of the stock with dividends and stocks from distribution reinvestment plan included. As long as the price of stock is above the breakeven price, I can sell the stock for a profit.
The column 'breakeven_price_status' indicates if the stock price is above the breakeven price.
Portfolio Snapshot - CAGR Oct 2018
Here's a snapshot of my current portfolio:
The column 'cagr' represents the compound annual growth rate of that stock.
The column 'cagr_inc_div_drp' shows the compound annual growth rate including dividends paid out and additional stocks obtained through distribution reinvestment plans.
The column 'cagr_benchmark' shows the compound annual growth rate of the benchmark. The benchmark is the SPDR STI ETF, stock code 'ES3'.
The column 'cagr_benchmark_status' shows yes if we beat the benchmark. The more 'Yes' the better.
The column 'returns_one_year' shows the returns in the past one year.
The columns 'cagr', 'cagr_inc_div_drp', 'cagr_benchmark', 'returns_one_year' are shown in percentages.
The column 'cagr_inc_div_drp' shows the compound annual growth rate including dividends paid out and additional stocks obtained through distribution reinvestment plans.
The column 'cagr_benchmark' shows the compound annual growth rate of the benchmark. The benchmark is the SPDR STI ETF, stock code 'ES3'.
The column 'cagr_benchmark_status' shows yes if we beat the benchmark. The more 'Yes' the better.
The column 'returns_one_year' shows the returns in the past one year.
The columns 'cagr', 'cagr_inc_div_drp', 'cagr_benchmark', 'returns_one_year' are shown in percentages.
Friday, June 29, 2018
Portfolio allocation - Jun 2018
| Year | Stocks + REITs - Singapore | Stocks + REITs - US | Stocks + REITs - Developed | Stocks + REITs - Emerging | Bonds | Cash |
|---|---|---|---|---|---|---|
| 2017 | 43% | 3.23% | 1.56% | 1.54% | 7.6% | 42% |
| 2018 | 53% | 8.84% | 1.71% | 1.64% | 8.82% | 26.03% |
Overweight on Stocks + REITs - Singapore, and too much cash.
Will slowly tune this, and update every year in June.
Subscribe to:
Posts (Atom)