I took a look at the charts today.
Typically, I do not follow technical analysis religiously, but thought I will just take a look and make a note.
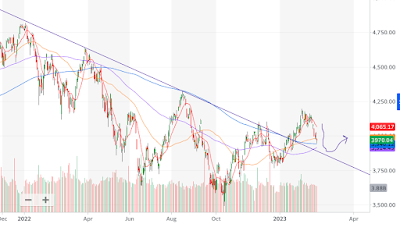
S&P500 broke out of the long-term downtrend around 24 Jan 2023, which bodes well. But now the S&P500 dropped after a short bull run. From the charts, it looks like it will continue dropping to 3870 to 3890 area before a rebound.
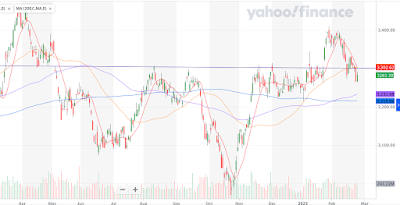
It recently broke through the resistance level at 3302. Also, there is a bearish crossover of the 10 and 50 day simple moving average. Room for further fall, before a rebound.
Only time will tell, let's see.


No comments:
Post a Comment