Around one month ago I drew the below chart in this post: http://financeopti.blogspot.com/2023/02/state-of-s-and-sti.html (note the hand-drawn arrow on the right):

It turned out that after one month the market moved exactly as in accordance with the arrow I drew above!

Since the S&P500 broke through the downtrend resistance, there should be more upside to come in the short term.
As for the STI, this is the chart from one month ago:

Here's what I said one month ago about the STI:
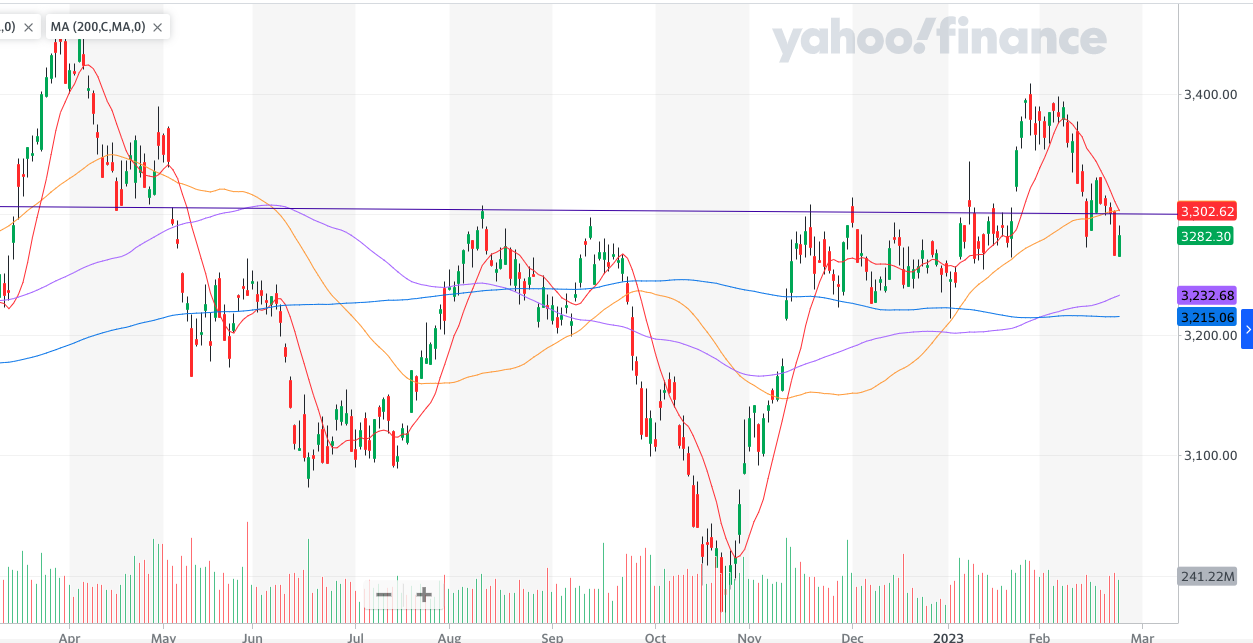
It recently broke through the resistance level at 3302. Also, there is a bearish crossover of the 10 and 50 day simple moving average. Room for further fall, before a rebound.
It turns out that is exactly what happened - the STI fell to around the 3100 level before re-bounding:

Woohoo!